Improving Site Performance: A New Hope For Fast Sites

A slow site has negative impacts on search engine optimization, can increase bounce rate, and reduce site conversions. Taking a surgical approach and understanding the cause of the problems can help you effectively ‘treat’ the site and alleviate the symptoms.
But sometimes issues aren’t “internal” -- just like in medicine, sometimes one’s symptoms can be caused by external or environmental factors. So if you’re looking at less-than-ideal site performance, it’s always worthwhile to look at off-site assets.
*This blog is the fourth and final blog in Martin Anderson-Clutz's series devoted to site speed performance issues.
Read Part One | Read Part Two | Read Part Three | This Is Part Four
In the first instalment, we talked about a high-level way to triage our Drupal sites, to identify problem areas, each of which has separate approaches for improvements. The next two installments talked about dealing with issues for page speed or on-site assets (especially images).
Today we look at off-site assets, which can be defined as page elements loaded from an external site, also known as third-party assets. They can be visible elements like images, invisible elements like Javascript libraries, or they could actually be calls to a web service, like Google Analytics.
A Growing Challenge
Although on-site assets are often the biggest culprit for slow loading pages, off-site assets are a growing challenge for a couple of reasons.
HTTPS
Now that all pages should be served via HTTPS, having the visitor’s browser connect to a new domain requires an additional DNS lookup, server connection, and SSL negotiation, all of which commonly take significantly longer than the actual download of the resource being accessed.
Here’s an example of what that can look like:
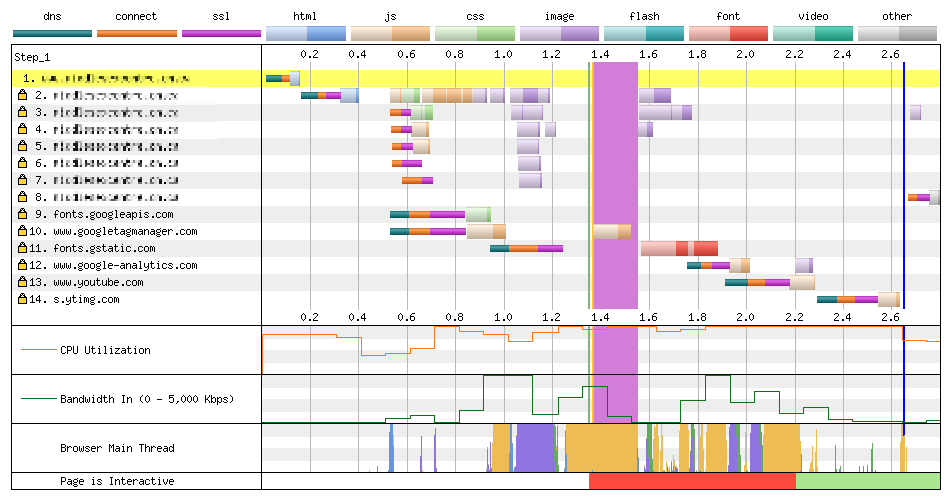
Note that the call to the YouTube API (from Google Tag Manager) took 3ms to download, but each of the steps before that took substantially longer:
- DNS Lookup: 91 ms
- Initial Connection: 72 ms
- SSL Negotiation: 101 ms
- Time to First Byte: 102 ms
- Content Download: 3 ms
The example above illustrates the second reason third-party assets are a growing issue: the prevalence of tag management systems like Google Tag Manager.
Tag Management
Google Tag Manager provides an enormous convenience by allowing Marketing teams to manage analytics and other tags related to reporting and remarketing.
The danger, however, is that while it’s simple to add tracking pixels for platforms like Facebook or LinkedIn, a marketing team can opt into the inclusion of unnecessary scripts or pixels, inflating load times in the process. This can be further exacerbated if marketing has the control to add tracking and other tags but not the accountability for the longer load times that they create.
What Can Be Done?
Less Is More
As we already discussed with modules, the most fundamental way to mitigate the bloat of third-party assets is simply to be judicious on which ones to use. Don’t add any “just in case” they might be useful down the road. With fonts, if it isn’t really necessary to have five different weights for the same fonts, see how much of a difference it would make to the overall design if you can make do with fewer.
In our earlier example of a marketing department with the power to add assets without the accountability for the performance issues those create, it may be possible to generate performance reporting that excludes these third-party assets, but this creates a risk of two teams working in isolation without a shared view of how their work impacts site visitors. It’s better to create shared accountability and create dialogue about how to prioritize the needs of marketing and balance them against the possible impacts of adding more assets.
Serve Locally
Where possible, serving assets locally (from within the site’s webserver) will remove the need for additional connections. With fonts there are a couple of trade-offs: remote platforms like Google have fully optimized the delivery of these assets and serving them locally can require extra work to optimize.
On the other hand, if your site is itself making use of a CDN like CloudFlare, this may be a non-issue. The only other real downside would be the loss of automatic updates as fonts are updated with ongoing improvements.
Finally, there could be licensing issues with serving fonts or Javascript libraries locally, so if you’re considering this approach, it’s a good idea to establish this early on, and make it a consideration early in development, for example when choosing fonts or libraries to use.
It’s also worth looking for alternatives. For example, instead of using native sharing widgets for a variety of social platforms, consider a single platform that can aggregate them into a single call, such as AddToAny, ShareThis, or even SimpleSharingButtons.com.
Going Under the Knife
Hopefully, by now you’ve done a high-level scan of your site, determined the problem areas, and have some strategies on how to make them better. Ready to go ahead an implement all of them? Don’t be too hasty. Here again, the approach matters.
Websites, like people, have their own unique quirks and just because a particular change improves site speed for most sites, that doesn’t guarantee it will make things better on yours.
The smart approach is to prioritize your changes, starting with the low-hanging fruit (low effort, high impact). Then implement in small increments, iterating quickly, but measuring in between to make sure you’re seeing the gains you expect, or potentially tweaking your changes, if necessary, before moving on.
Staying Healthy
With your critical issues addressed, the most important thing moving forward is to make sure you don’t end up with slow pages again at some point down the road.
What can you do to make sure we don’t slide back to where you started?
Visibility
The single most important concern is to make site performance a key metric for your site. Most likely you’re already using some form of analytics and there’s likely an existing report for this (in Google’s offering it’s at Behavior > Site Speed > Overview by default).
An example of this is in this image:
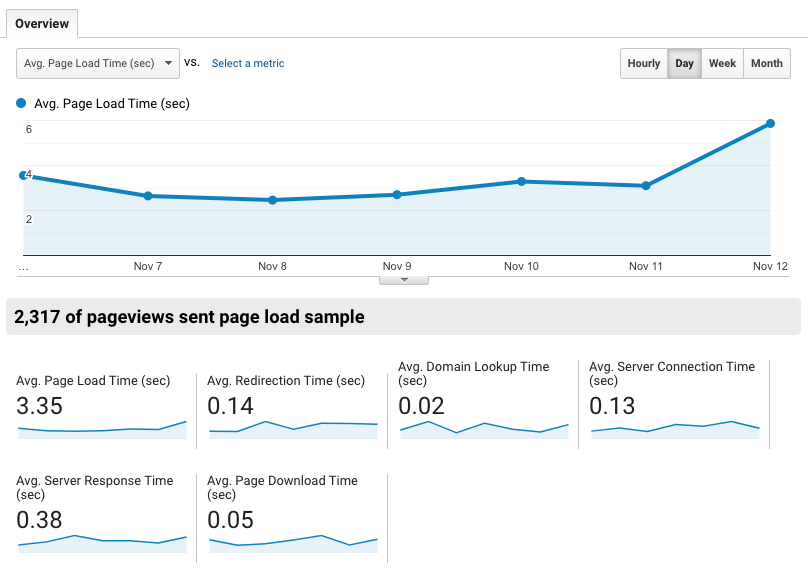
That’s an easy place to start and it has the added benefit of being audience-weighted: you get to see the speed of your site as experienced by actual visitors.
By sorting the listings by page to show the slowest pages first, you will see if there are specific pages that need extra attention. I like to keep the pageviews as a secondary metric, so you can also prioritize higher-traffic pages whose speed issues aren’t quite as acute.
Ideally, performance-related reporting should be part of your key performance indicator (KPI) dashboard and an element of your website reporting. You can also integrate performance tests into your CI using tools like Sitespeed.io, New Relic, or Blackfire.
Performance Budget
A really powerful way to keep control of your site performance is to create a performance budget. The process usually looks like this:
- Determine your target speed and a typical internet connection
- Figure out what that translates to, in terms of total amount of data
Performance Budget Calculator
The excellent (and free) Performance Budget Calculator makes it easy. It even gives you silders to decide how you want to ‘spend’ your budget on HTML, CSS, fonts, and so on.
Browser Calories
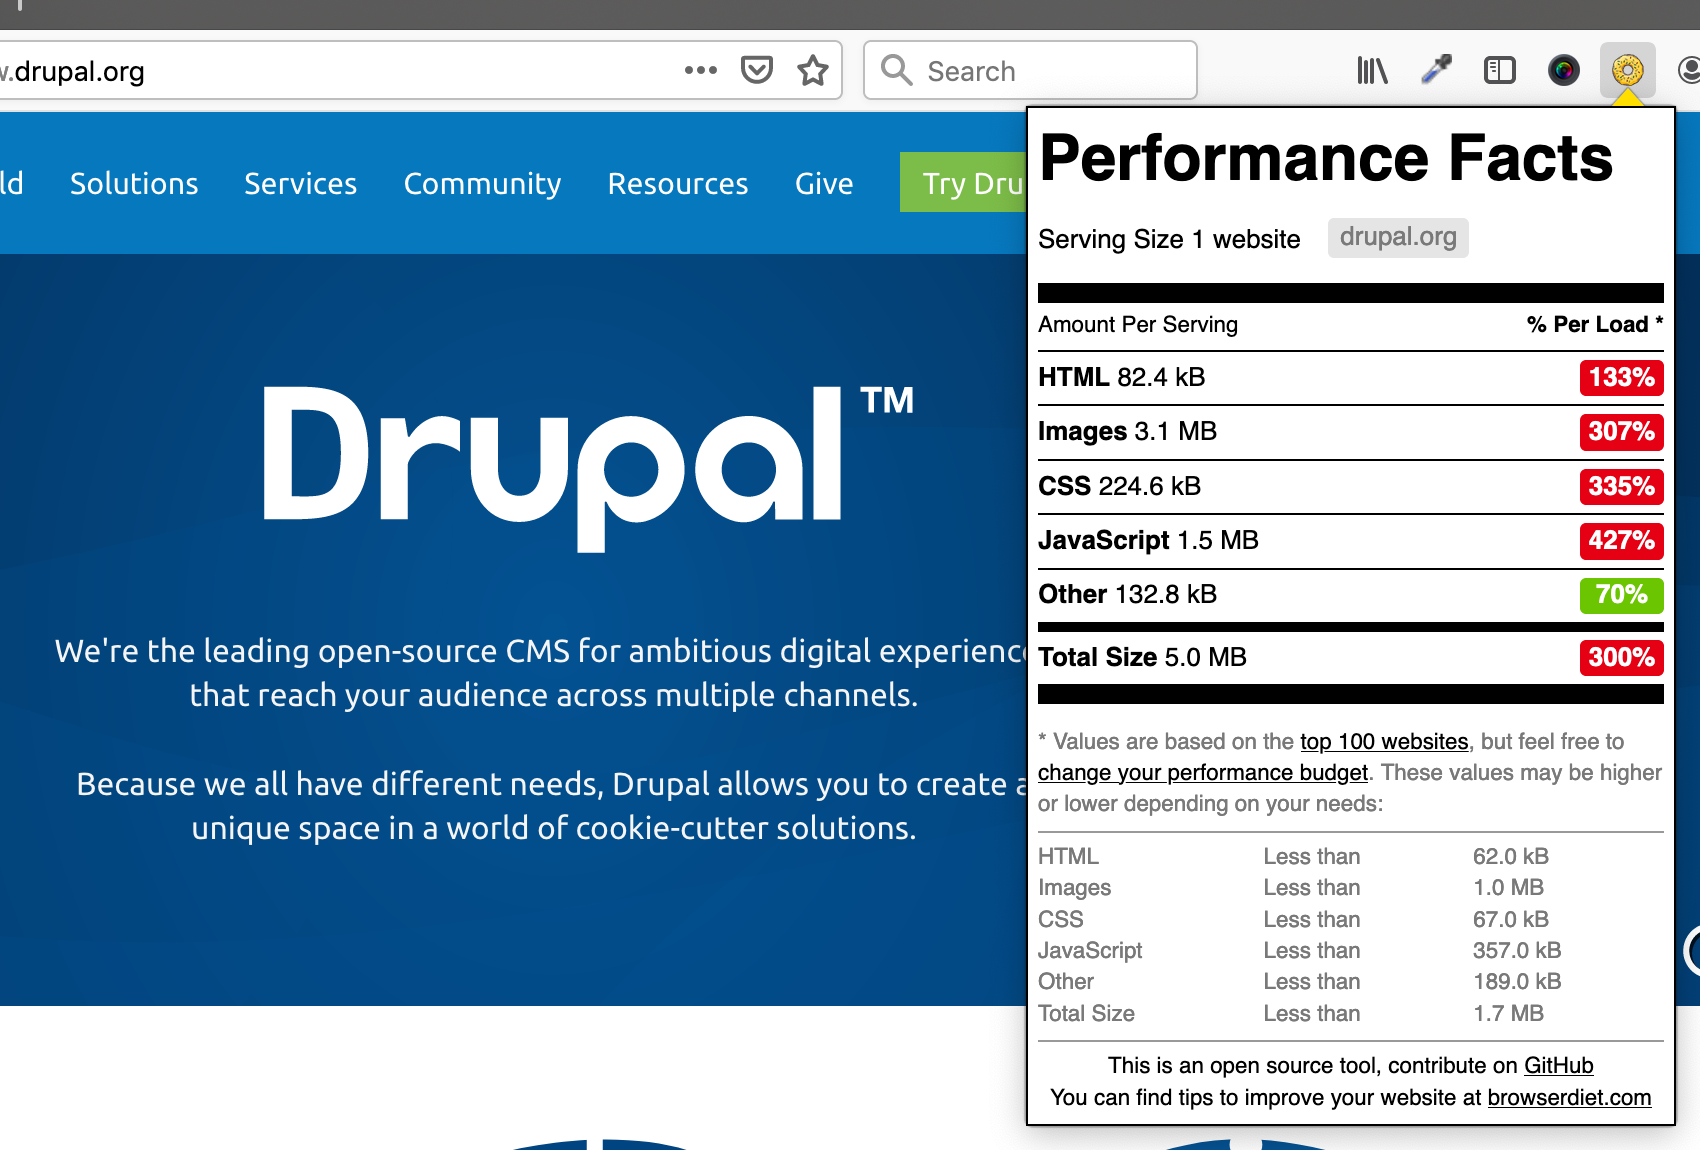
Taking this a step further, the Browser Calories extension lets you see how any page compares to your budget (by default it compares to the top 100 websites). It presents the comparisons in a fun nutrition-style guide, similar to what you’d see on a cereal box.
Closing
Hopefully, this series has given you a solid understanding of how to identify the problem areas on your site, and how to address them, as well as how to make sure it stays fast moving forward.
Everything I talked about in this four-part series is covered in this recording of a presentation I delivered at DrupalCon NA 2019 Seattle.
Let us know in the comments if there are any areas you’d like to see covered in more detail.
Read Part One | Read Part Two | Read Part Three | This Is Part Four
--
Did you enjoy this article? Get more just like it by signing up to receive Digital Echidna’s free e-newsletter, delivered to your inbox every month. Subscribe today.
SUBSCRIBE TO OUR E-NEWSLETTER
 Subscribe

