Virtually Scrubbing Up: Pre-’Surgery’ Site Speed Checklist

Just as with medicine, when you’re trying to fix site speed issues, you want to ensure that you’re curing the cause -- not just dealing with a symptom. An issue may present itself in one way, but the root cause can be something different, and a key component of taking a surgical approach to site speed issues is to make sure we take a moment to understand the challenge that’s before us.
If you walk into a doctor’s office with a swollen ankle, but not defined mechanism of injury, your doctor’s not just going to amputate your leg and call it a day (problem solved! No more swollen ankle). Instead, they’ll likely run a series of tests to determine what the root cause of the injury is. And the result can have dramatically different impacts on the type of work you need to do to rectify the issue: a bump might just need ice and elevation; but if the issue is circulatory in nature, them more invasive measures may be required.
It’s no different on a web site (well, hopefully, there’s significantly less blood, but you get the point). So, as promised in an earlier post, let me begin with the first part of my blog series on Site Speed.
If you’re just looking at site speed symptoms, it can be tempting to just put a virtual band-aid (for example, spending more on hosting) on the issue and call it a day. But by taking the time to explore, you may discover that the issue is far more systemic in nature and “simple fixes” may only cause another problem to show up somewhere else.
My first phase in the surgical approach is to begin by running tests. And I break down the priorities into three areas:
- Delineation
- Identification
- Isolation
Let's get to it!
Testing Strategy
Delineation
Some issues can be resolved; others have to remain in place. This is why I suggest you start with the delineation of issues. Create a list of what can and can’t be changed. The simple fact of the matter is that certain processes take time -- and if they’re integral to the overall functionality of the website and providing a result that’s of value to the user, then you have to keep them in place.
This is a great opportunity to start a dialogue with other key stakeholders on the project about essentials and “nice-to-haves.” We’ve all worked on projects where there are elements that are in place because maybe, someday, the client would like to implement this type of functionality. And that’s great because we never want to restrict the potential for our clients’ solutions to grow and scale to their needs.
However, there has to be an appreciation of the impact. It’s like when you go into a store and see products drastically marked down -- the reason is that the inventory cost of storing these products outweighs their value. It’s no different on a website -- that “inventory cost” for potential functionality (memory, speed, impact) may outweigh the perceived value. By identifying the elements and their impact, it’s possible to have a positive discussion about what’s integral and what can be removed.
A great example is tracking pixels. With the prevalence of Google Tag Manager, a marketing team can easily add tracking pixels to allow for remarketing on a variety of platforms. What they may not realize is that these pixels come with performance overhead. Even if the actual data load is negligible, the time it takes for the browser to make a secure connection to each platform can add up quickly. Often they don’t realize the performance impact, or the business implications of slowing down the site, and would consider these tracking pixels “nice-to-haves”.
Identification
It’s important to not only recognize what’s causing challenges but also where those challenges are popping up. By identifying on which pages there are performance concerns can help you identify solutions and prioritize effort.
There’s a big difference between a performance issue on your most-accessed page or in your search, and a performance issue on a site that only receives traffic once in a blue moon. Understanding where these issues are arising can allow you to determine what kind of response -- if any -- is needed.
Isolation
Once you know the what and the where you can start focusing more in-depth on the why. Why, specifically, is it within those pages that you’ve “identified” performance issues, are contributing to slow performance?
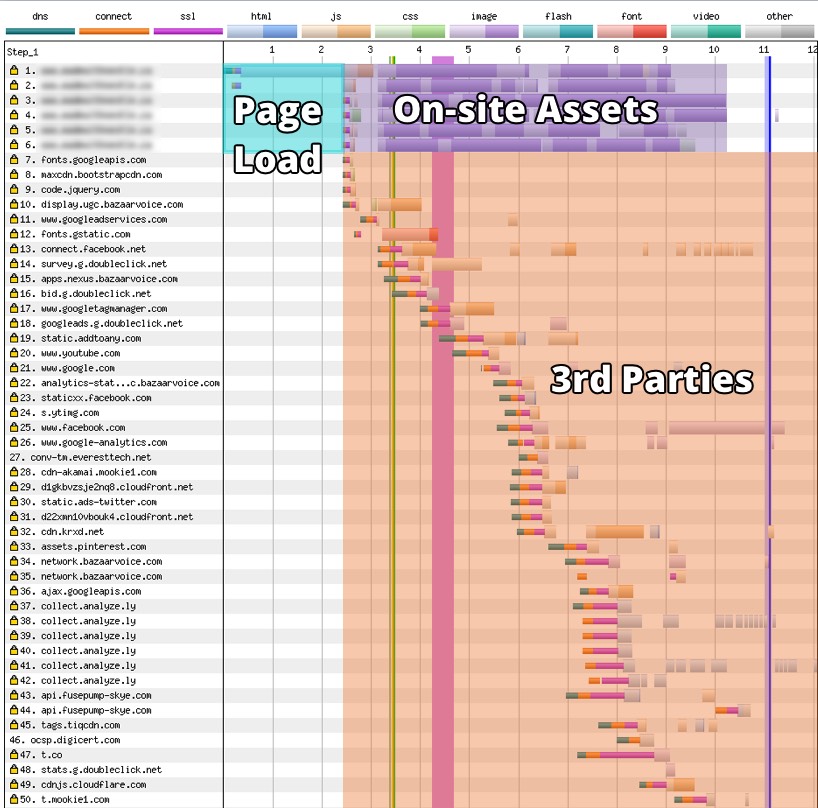
For this last step, I recommend grouping the elements that load within a page into three groups:
- Page load
- On-site assets (such as CSS, JS, and images); and
- Third-party integrations (such as JS libraries, fonts, tracking pixels, etc.)
I’ve included a redacted version of a document that I use to identify and isolate issues to give you a visual of how this can be performed.

By taking the time to accurately evaluate the issues and understand the root cause, you arm yourself with the knowledge you need to succeed. To quote Flint from G.I. Joe, “knowing is half the battle”.
Explore how you can execute solutions based on this knowledge: Read part two.
--
Did you enjoy this blog? Get more just like it by signing up to receive Digital Echidna’s free e-newsletter, delivered to your inbox every month. Industry tips, information, and expertise to aid the health of your digital project. Subscribe Today.
What is the best approach to testing site speed?
SUBSCRIBE TO OUR E-NEWSLETTER
 Subscribe


